

Photo by Brady Rogers on Unsplash
How to collect and visualize data lineage in an AWS-based data lake
Showcasing the automated collection of data lineage and visualization as Graph in a React Frontend for Spark-based data pipelines.


In this article, we will go over a reference architecture for a Spark/Glue-based Data lake in AWS, we will discuss on the possiblities how to collect data lineage in this architecture and then describe how to visualize and interact with the collected metadata.
Quick refresher: Data lineage (aka Data Provenance) surfaces the origins and transformations of data and provides valuable context for data providers and consumers (M. Herschel, R. Diestelkämpfer, 2017)
This article is based on our research work at the BMW Group about an automated collection and visualization of data lineage throughout data pipelines - check out our paper here.
Spark and Glue
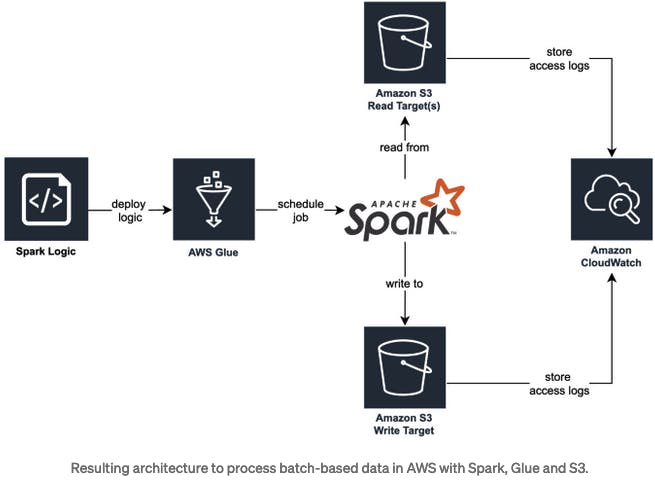
Starting in the 2010s, distributed-data-processing frameworks such as Apache Spark have increasingly gained momentum to help data engineers and scientists process data at the scale of petabytes. Although the surroundings are changing increasingly towards cloud-native and centralized data strategies such as data lakes, Spark remains relevant for batch-based ETL (Extract, Transform, Load) jobs in the data engineering universe. If you would like to know more about data lakes and their challenges regarding metadata, checkout my previous article.
Within AWS Glue, data engineers can discover, prepare and combine data in a serverless environment, which enables easly scaling and on-demand pricing of ETL jobs. In our case, data is extracted from and written to S3 buckets and processed in Glue via Spark transformations. Stream-based ETL jobs might be processed within AWS Lambda — but these are out of scope for this article.
Discussion of data lineage collection mechanisms
Now, if we would like to automatically track the data lineage of these ETL jobs, there are essentially three entrance points where we can collect data lineage.
Static Code Analysis
We could use static code analysis to extract lineage directly from the source code. However, with increasing code complexity this is difficult to achieve. Furthermore, Spark optimizes the sequence of operations and might execute the pipeline in a changed sequence. It might even skip operations that do not have any effect. There is also no knowledge extraction during job runtime. Summarizing, we can only collect partial information about the data lineage with this complex approach.
S3 access logs
We could facilitate our system to analyse S3 access logs via CloudWatch. We can hence track read and write access to data and correlate these events to other datasets and/or jobs, meaning that we can generate coarse-grained lineage. This approach constitutes a complex engineering endeavor, and we are in addition to that not able to extract details on the logic of Spark jobs (which means that fine-grained lineage cannot be generated).
Spark’s built-in API
We could use Spark’s built-in API to extract details on a job’s execution plan, meaning that we are able to process the transformation steps on the data itself. Open-source tools such as Spline (Agent) automatically transform these execution plans and hence provide a solid foundation for the data lineage extraction.
The latter can be further leveraged to formulate fine-grained data lineage, which is why we decided to embark on this path.
Architecture for automated data lineage collection
Especially in bigger companies, it is quite common to have multiple accounts at a cloud vendor. In our scenario, each stakeholder that provides data into the data lake maintains an own AWS account. The data provider utilize a Terraform Module to build ETL jobs, which integrates the Spline Agent as Spark Splugin and is configured to send the tracked lineage to a central API (Producer API). By doing so, we centralize all lineage information within one account instead of scattering it among many accounts.
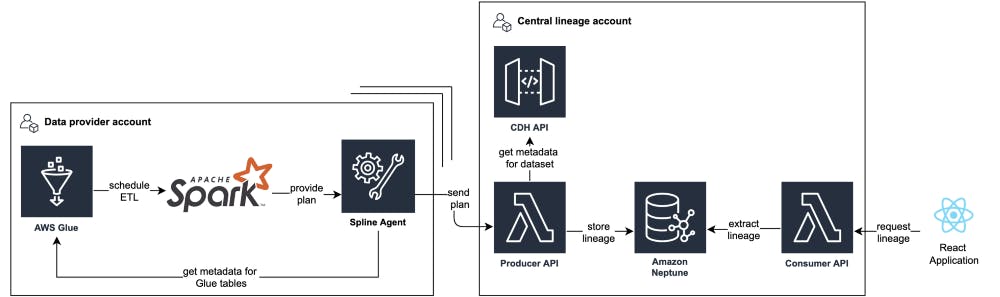
Within the Producer API, we add more context to the collected data and persist the entities within Amazon Neptune, a graph database. As data lineage inherently describes a graph-like structure, we chose a graph database to easily store and extract data lineage with the traversal language Gremlin. We provide access to the lineage graph via the Consumer API, which is utilized by our React frontend application.
With the described archtitecture we centralize processing, storage and provisioning at platform-level to capture the complete transformation path. How we visualize data lineage for our stakeholders
Our React app effectively combines fine- and coarse-grained lineage, and hence provides rich context on a dataset’s upstream and downstream provenance as well its operations. As interdependencies between datasets can become quite hard to understand — even when visualized as graph — a user-centric and intuitive approach to visualize lineage is quintessential.
A popular method to layout directed graphs is the Sugiyama algorithm, which is implemented in the ELKjs library. Reaflow is a recently open-sourced library to draw graphs in React application and utilizes the ELKjs library under the hood. We use Reaflow to build graphs efficiently with visually appealing layouts, and customize the nodes as we see fit. By utilizing the Sugiyama fundamentals, we achieved the following layout properties for the graph:
- The graph is structured hierarchically from left to right, and the direction of edges represents the data flow between nodes.
- Nodes on the same hierarchy are centered and balanced evenly and dynamically.
- Edges are drawn (mostly) directly with Bezier curves.
- Data flow is from left to right.
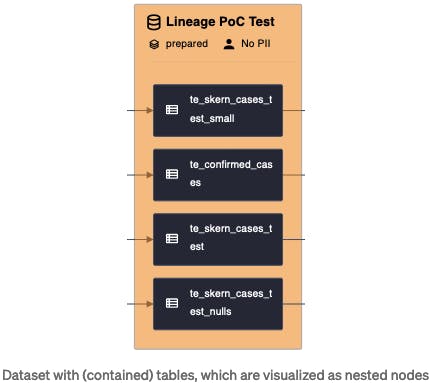
A key concept for building the graph is to represent coarse- and fine-grained data lineage in conjunction. Therefore the key elements are jobs and datasets, which contained nested nodes that represent the respective job executions and tables. For jobs, we can get insights in the run time and even in the job run history and the job run status (Success / Failed). For datasets, we can get some more metadata from the data catalog such as the data owner and the context of the dataset, but also on the tables and the contained attributes and their data types.
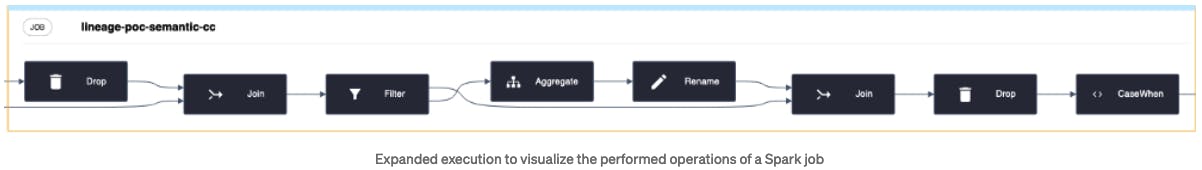
Each execution can then be dynamically expanded by clicking on it. The ex- panded execution will then show the steps to transform the data. These transformation steps can then also be investigated further for the transformation expression or the input and output schema.
In conjunction of the previously described elements, we visualize the data lineage as following. To better describe some more elements in the UI around the graph, we numbered some components:
- Search bar for other datasets (switches the lineage focus to another dataset)
- The currently focused dataset is shown in the bar and shown as orange filled node in the graph. To not overwhelm the user with information, we restrict the shown interdependencies to one layer of up- and downstream datasets of the focused dataset.
- We also offer users to search for individual attributes, which increases the lineage graph’s usability by indicating searchable attributes. The suggested attributes are based on those occurring in the current graph, and users from type-ahead suggestions based on their provided input to quickly find the right attributes. As a result of a user selecting an attribute, each node in the graph containing the attribute is highlighted.
- The toggle enables users to switch between fine- and coarse-grained lineage. While the graph constitutes a composition of fine- and coarse-grained lineage including datasets, tables, jobs, and operations, the simplified graph only displays datasets and jobs.
- In the details section, we display more context depending on the selected node within the graph. For example, while the executions tab offers additional details on individual job runs when selected, the tables tab provides context on the parent dataset and schema metadata. Moreover, we display the concrete expressions for selected operations in a human-readable format (e.g., a Drop operation will provide details on those attributes that were dropped).
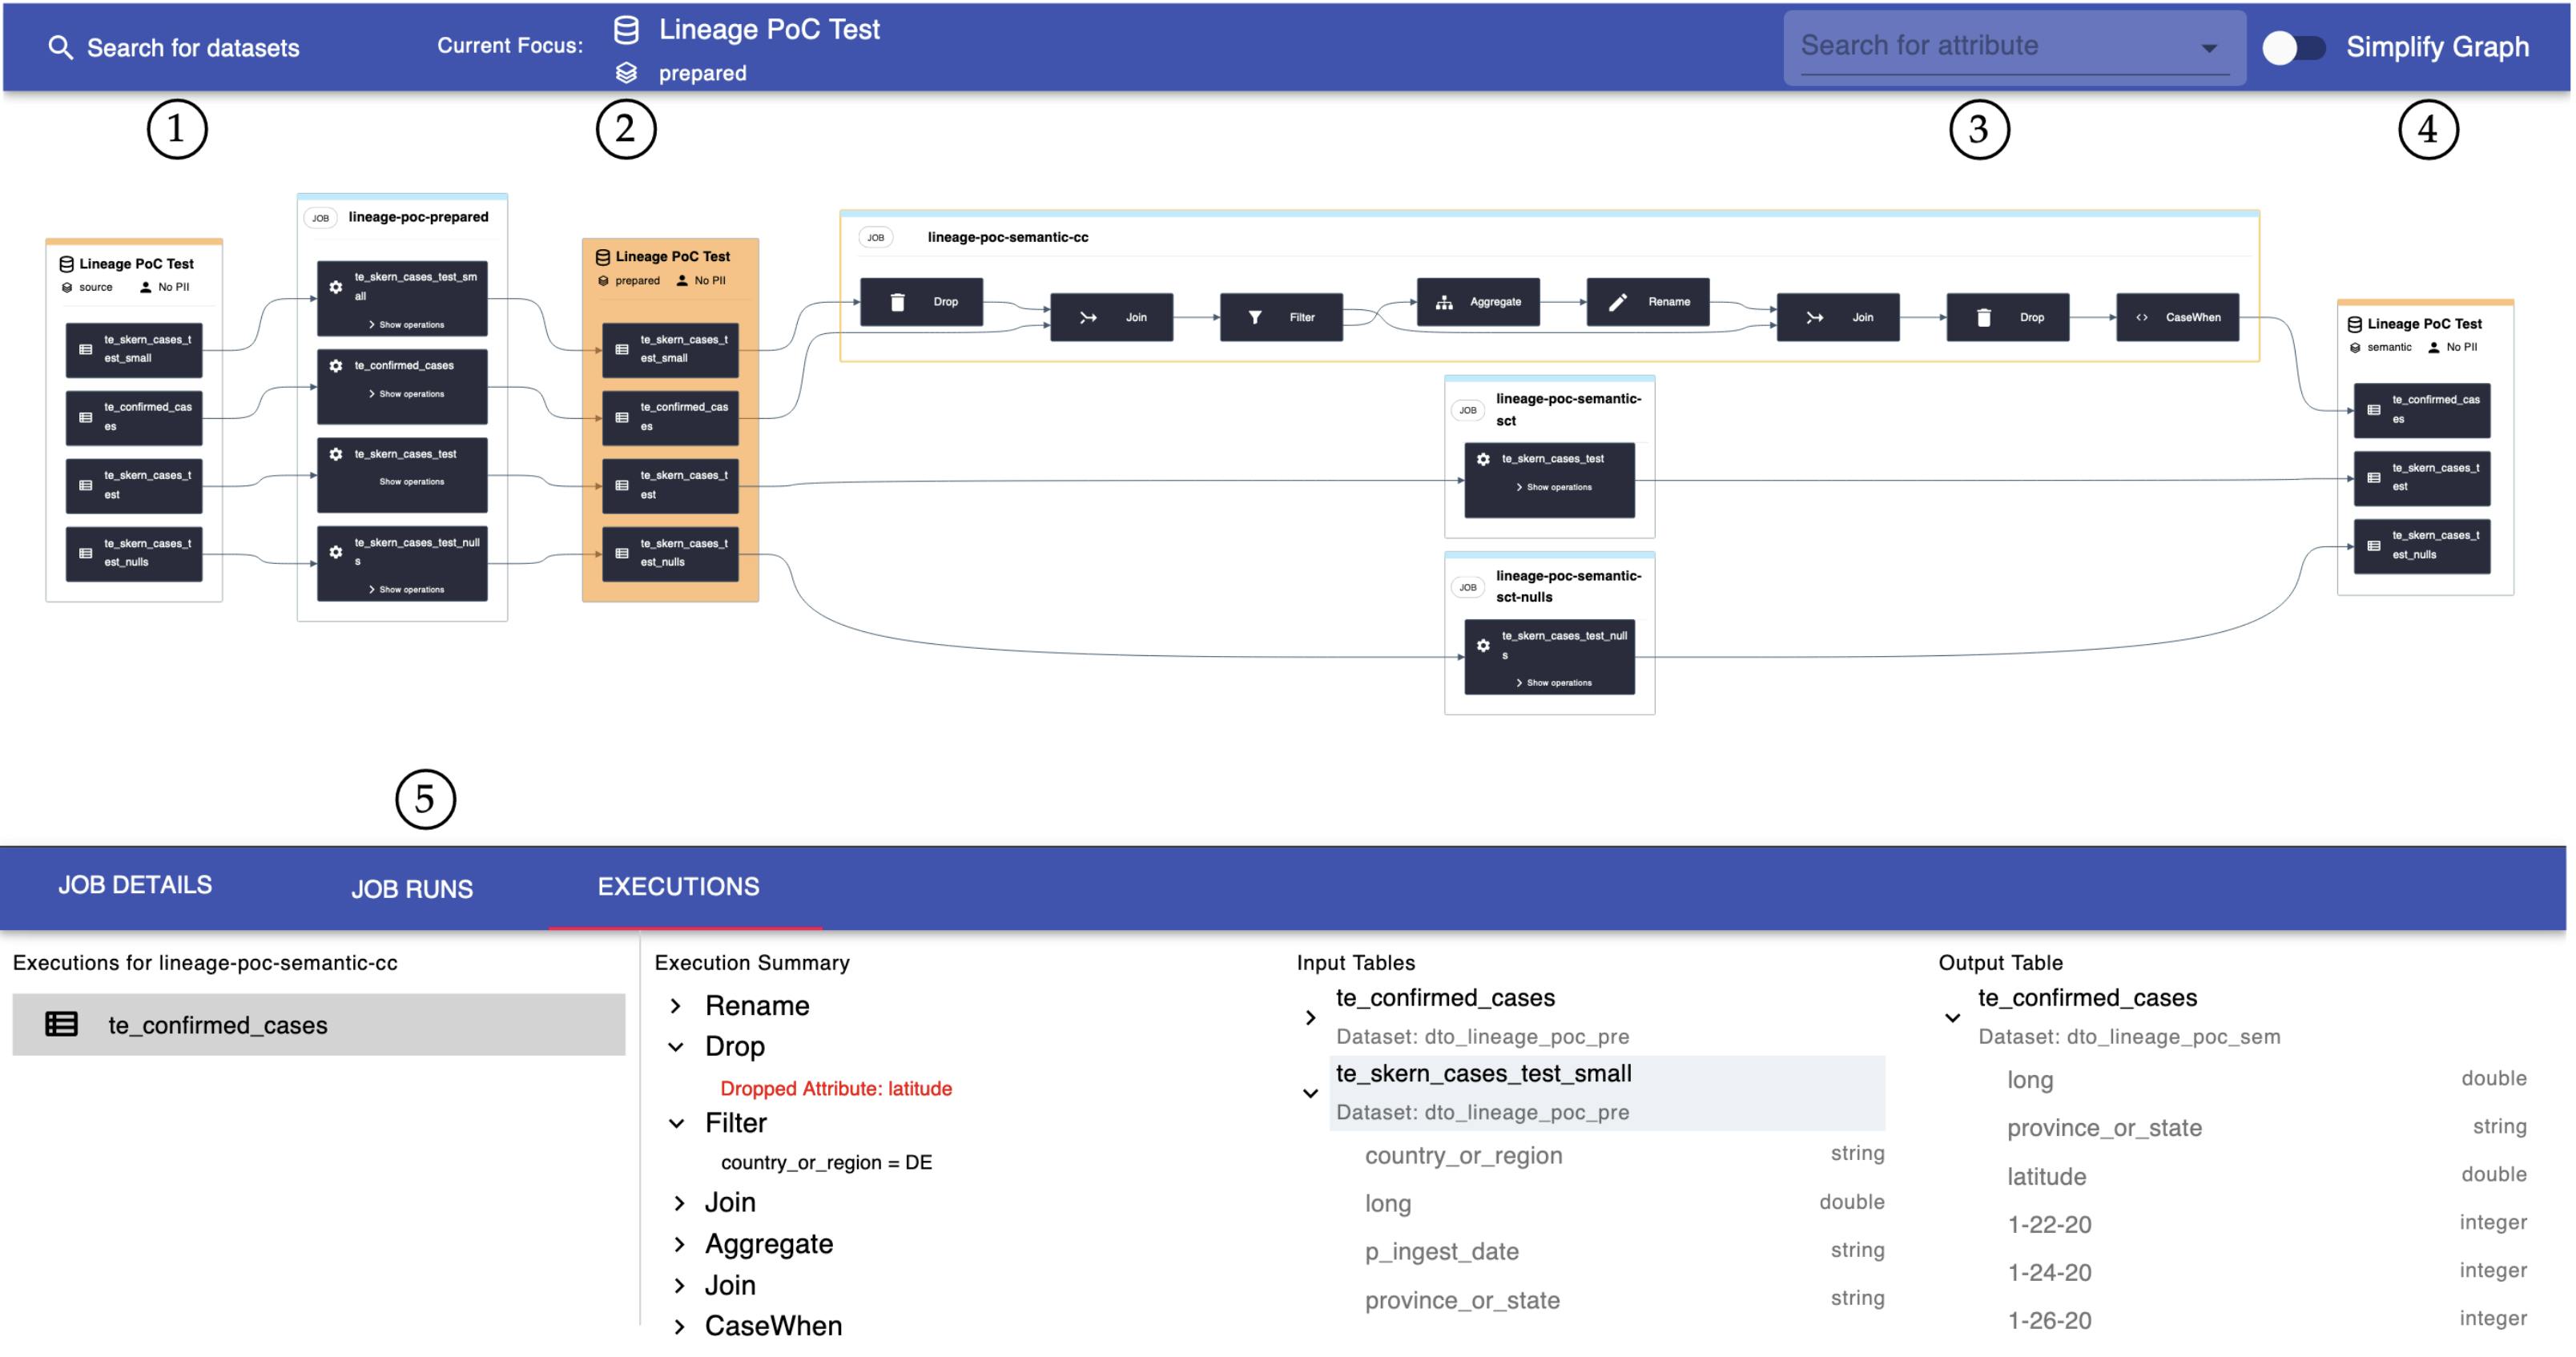 React frontend to visualize coarse- and fine-grained data lineage
As part of our user interviews, we received positive resonance on the features of our application and its design. We acknowledge, however, that there is still room for improvement with regards to, e.g., the navigation between datasets and depth of visible neighbors.